 CHI
CHI @CAR
@CAR MIN
MIN PHI
PHI NYJ
NYJ @GB
@GB @ATL
@ATL NE
NE @SEA
@SEA TB
TB NO
NO @DET
@DET JAX
JAX @MIA
@MIA @BUF
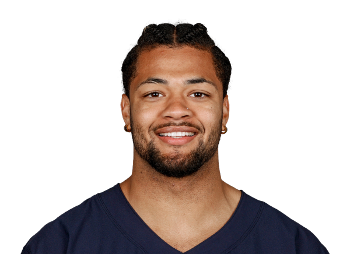
@BUFRome Odunze — WR, CHI — 2026
Verdict
TARGET (high confidence) at ADP 55.0 (FFC PPR, 2026-07-07 — priced as the WR28, behind teammates Luther Burden III at 46.2 and Colston Loveland at 44.8). The market is pricing Odunze's actual 2025 box score (44-661-6, 12.2 PPG); the usage says he was already the WR15 in expected points per game (14.2 xFP/gm) with a 23.8% in-game target share, 38.2% air-yards share, 27.1% red-zone target share, and 91.5% route participation — and the two players who ate 150 targets (DJ Moore 85, Zaccheaus 65) left with no round-1–2 receiver capital added. Why the market is wrong: it's blaming the receiver for the quarterback — only 62.6% of Odunze's targets were charted catchable vs a 74.5% league average — and it's treating an unsurgical foot fracture plus a 5-game absence as a talent signal. Buy the WR15 usage at a WR28 price; the efficiency normalization (Caleb Williams year 3, drop-rate regression) is free upside on top.
Bull case
- WR15 usage at a WR28 price: 23.8% TS / 38.2% AYS / 0.624 WOPR / 91.5% RP in-game, 14.2 xFP/gm — and 150 vacated targets with no capital added push the median path to ~125 targets and TS ≥26%. The market anchor is his injury-wrecked box score.
- Elite, earned TD role: 27.1% RZ target share, 11 end-zone targets in 12 games, xTD 6.71 vs 6 actual — the 2025 TDs were usage, not luck, and the usage is expanding.
- Efficiency has an identified, external cause: 62.6% catchable rate (lg 74.5%), −9.4 CPOE on his targets, 11 of 23 deep balls uncatchable. He posted 2.21 YPRR and 15.5 PPG over the 7 games he was healthy. Year-3 QB accuracy improvement is the cheapest lottery ticket at this ADP.
Bear case (the hater's version)
- The foot is not fixed — it's "managed." Unsurgical stress fracture, his own words: a "new normal" that may never feel fully right (NBC/SI, June 2026). Feet recur; 20% of outcomes involve missed games and a capped route tree, and his wks 9–13 (7.6 PPG) showed exactly what a compromised Odunze produces.
- Two seasons, zero 750-yard years, sub-50% catch rate in 2025 — and it wasn't all Caleb: 7 drops (12.3%), 31% contested-catch rate, and a "sacrificial X" risk in a run-tilted (−3.9 PROE) offense where Johnson's stated priority is feeding Burden and the market already ranks Burden and Loveland ahead of him on their own team.
- Boundary-dependent points: ~80% of targets outside the numbers and aDOT 13.9 = the fragile-floor archetype; if the LT situation compresses this offense to the quick game, Burden/Loveland/Swift absorb it and Odunze's profile starves.
Projection & comps
Bottom-up build (team volume from data/team-profiles/CHI.md, 2026-07-07: ~65 plays/g × ~57% pass ≈ 35.5 pass plays/g, ~33.5 att/g, Vegas win total 9.5):
| Scenario | Games | Routes (RP × team pass plays) | TPRR → targets | Catch% | Y/tgt | Rec–Yds–TD | PPR |
|---|---|---|---|---|---|---|---|
| Floor (p20) | 13 (foot flares) | ~415 (90%) | 0.215 → 89 | 49% | 7.0 | 44–640–5 | ~140 |
| Median (p50) | 16 | ~517 (91%) | 0.24 → 125 | 53% | 7.6 | 66–950–8 | ~209 |
| Ceiling (p80) | 17 | ~555 (92%) | 0.26 → 144 | 56% | 8.2 | 81–1,180–10 | ~260 |
- TD anchor: computed xTD was 6.71 on 90 targets in 2025 (0.075/tgt — pbp + league depth/EZ rates) vs 6 actual — his TD total was *earned*, not luck. Median uses a regressed 0.064/tgt; his end-zone target density (11 in 12 games) supports 8+.
- Median = 13.1 PPG, between his 2025 actual (12.2) and his 2025 xFP (14.2) — deliberately conservative on efficiency.
- Games-played risk: medium — 2025 foot stress fracture healed *without surgery*; Odunze says the foot has a "new normal" and may never feel fully normal (NBC Sports/SI, June 2026), but he was a full participant making plays at June minicamp (FOX 32/WCG, June 2026) with no current injury designation (Sleeper, 2026-07-07).
Comp seasons (boundary X, big EZ role, developing/inaccurate QB, vacated-target inheritance; lines from historical record): Courtland Sutton 2024 DEN (81-1,081-8 with rookie QB) ≈ median; DJ Moore 2020 CAR (66-1,193-4 on 118 tgt) = high-yardage/low-TD median variant; Jerry Jeudy 2024 CLE (90-1,229-4 — volume through bad QB accuracy) = median-plus; Mike Williams 2021 LAC (76-1,146-9) and Drake London 2024 ATL (100-1,271-9 after vacated targets + QB step) = ceiling shapes.
No external projections found in data/projections/ (directory absent) — no sanity-check disagreements to log.
Usage profile (2025, 12 REG games; 2024 in parens)
All rates computed from nflverse pbp + data/stats/ caches pulled 2026-07-07. "In-game" = his games only; season-aggregate share from receiving.csv is deflated by his 5 missed games (TS 16.9%, AYS 27.6% aggregate).
| Metric | 2025 (2024) | Band | Read |
|---|---|---|---|
| Target share (in-game) | 23.8% (18.8%) | Good, near-elite | +5 pts y/y; 150 vacated targets give a role-driven path to ≥26% |
| TPRR | 0.231 (0.181) | Good | Earning-rate jump is the leading indicator of further TS growth |
| Route participation | 91.5% (90.6%) | Elite | Full-time even in a 31%-12-personnel offense; dipped to 63–67% wks 10–12 while playing hurt (injury-explained) |
| Air-yards share (in-game) | 38.2% (33.5%) | Elite | Owns the downfield offense |
| WOPR (in-game) | 0.624 (0.517) | Good→Elite | Role-driven path above 0.65 with Moore/Zaccheaus targets redistributed |
| RZ target share (in-game) | 27.1% (13/48) (21.8%) | Elite | Plus 6 of 19 inside-10 targets |
| End-zone targets | 11 in 12 gm (16) | Elite rate | T-10th–15th in total despite 5 missed games; top-5 per-game pace |
| xFP | 14.2/gm — WR15 (computed, pbp depth/EZ expected-value model) | WR1/2 borderline | Actual receiving output 12.3/gm — 1.9 PPG below expectation, QB-accuracy-driven (see §6) |
2×2 read: high RP + rising TPRR = full-time earner still ascending — the healthy version of this profile is a target hog.
Splits that matter: Weeks 1–8 healthy (7 gm): 56 targets (8.0/gm), 473 yds, 5 TD, 15.5 PPG (weekly.csv); FantasyPros charting adds 23.9% TS, 15.8 xFP/gm, 2.21 YPRR — top-20 WR in all three (FantasyPros/Erickson, 2026). Weeks 9–13 (heel wk9, ankle wks 10–11, foot fracture worsening): 34 targets, 188 yds, 7.6 PPG. Playoffs (2 gm, fresh off the fracture): 6 targets each but 13–14% TS. The full-season line is an injury artifact; weeks 1–8 is the real signal per methodology §2.
Target quality, alignment, coverage
- aDOT 13.9 (1,252 air yds/90 tgt; NGS intended 14.1) — deep-leaning band: volatile weekly, TD-rich. Depth mix 2025: 3% BLOS / 39% short / 32% intermediate / 26% deep — earns at 3 of 4 depths, a genuinely full tree, not a go-route-only profile.
- Field zones: only ~20% of targets between the numbers by throw direction (18 middle / 72 boundary, pbp) — boundary-heavy, below the 45% MOF-earner threshold → floor discount applies. Partial mitigation: he is not boundary-locked by alignment — 33.5% slot rate in 2024 (PlayerProfiler) and ≥20 slot snaps in 8 of 12 games in 2025 (PFF via Yahoo/BearGoggles, 2026).
- Coverage splits: route snaps faced 276 zone / 114 man (participation.csv 2025); target-level man/zone YPRR-TPRR splits UNVERIFIED (no receiver-level coverage join in cache; not found free). NGS separation 2.98 (2025) / 2.96 (2024) — average-plus, stable. Contested catch: 55% in 2024 (12/22) but 31% in 2025 (5/16) — fragile y/y as expected; don't pay for a rebound, but don't extrapolate the collapse from a season played on a broken foot either.
- Trust chain / designed touches: Johnson's manufactured touches go to Burden by stated design ("get the ball in his hands as often as we possibly can" — Sun-Times, 2026-05-29); Odunze's targets are earned downfield ones. That's the sturdier kind, but it makes him more QB-dependent.
Efficiency — QB-driven vs WR-driven (the crux)
| Metric | 2025 (2024) | Band |
|---|---|---|
| YPRR | 1.69 (1.31) | Below-good; 2.21 wks 1–8 (FantasyPros) |
| First downs/route | 0.095 (37/390) | Good |
| YAC over expected | +0.97/rec (+0.50) | Positive 2 straight yrs (NGS) |
| Catch rate | 48.9% (53.5%) | Ugly — but see below |
| Catchable-target rate | 62.6% vs 74.5% league avg (58.4% in 2024) | QB problem, 2 straight yrs (FTN charting × pbp join) |
| Drop rate (drops/catchable) | 12.3% — 7 drops (3.4% — 2) | 2025 concern; one-year spike, clean rookie year |
| Deep balls (20+ air yds) | 23 tgt, only 12 catchable, 8 caught | The deep game died on accuracy, not separation |
Read: this is the methodology's textbook high-TPRR + low-catch-rate buy signal. Caleb Williams' CPOE was −6.9 overall and −9.4 on Odunze's targets specifically (pbp 2025). The honest WR-side debit: 7 drops and a contested-catch collapse in 2025 — some of the 1.9 PPG under-performance vs xFP is on him. Both of those are the *least* sticky stats in the profile; the catchable-rate problem is the one that must improve, and it's the stated No. 1 development item for the QB (team profile, chicagobears.com).
Context (from data/team-profiles/CHI.md, built 2026-07-07)
- Play-caller: Ben Johnson, year 2 of the install, still calling plays (new OC Press Taylor does not). Run-tilted (PROE −3.9%) but 4th in plays/game (67.1) and 8th in EPA/play — volume comes from pace and drive-sustaining, not pass rate. ~570 projected team attempts caps the target pool; concentration, not volume growth, is the bull mechanism.
- QB: Caleb Williams, year 3 — franchise-record 3,942 yds, 27/7, only 24 sacks, but CPOE −6.9. Benching risk none. Any accuracy step is pure Odunze upside; a Bagent contingency (tier C) hits his deep X role hardest.
- O-line: No. 1 PBWR unit protects the deep/PA game; LT Braxton Jones (4 games in 2025, top backup out 9–12 months) is the single point of failure — a quick-game compression would hurt this aDOT-13.9 profile most.
- Vacated targets: 150 (Moore 85 to BUF, Zaccheaus 65 to ATL) with only a 1-yr Kalif Raymond and R3 Zavion Thomas added → fires the §6 green flag (≥120 vacated, no capital). Odunze is No. 1 on the post-minicamp depth chart (SI, June 2026; Sleeper depth chart LWR-1, 2026-07-07).
- Competition: Burden III (slot, Johnson's schemed-touch guy, 60 tgt as rookie) and Loveland (TE1, 82 tgt as rookie) are real and ascending — but they claim different areas of the field than Odunze's boundary/downfield/end-zone territory. 31% 12-personnel gates the WR3, not the WR1.
- Pedigree: 2024 NFL draft No. 9 overall; age 24 (b. 2002-06-03), 6'3"/214, Washington, year 3 (Sleeper, 2026-07-07) — squarely inside the year-2–3 breakout window with rising TPRR and departing target competition (methodology §9's "single most profitable WR buy" pattern).
Tripwires (void this eval and re-run)
- Any foot recurrence/setback — a single missed padded practice or preseason game attributed to the foot → games_risk to high, verdict re-check.
- Camp/preseason reporting that Burden is the clear first-read target leader with the first team (or Odunze's first-team route share slips below ~85%).
- ADP rises inside ~pick 40 / WR20 — the usage-vs-price gap that drives TARGET is gone (flips toward HOLD).
- Braxton Jones injury or benching at LT → offense compresses to quick game; deep X profile downgraded.
- CHI adds a veteran boundary WR of consequence (trade/FA) before Week 1.
Sources
data/stats/2025/+data/stats/2024/: receiving.csv, weekly.csv, ngs_receiving.csv, participation.csv, ftn_charting.csv, injuries.csv, rosters.csv — nflverse via nflreadpy, pulled 2026-07-07. RP/TPRR/YPRR computed from participation.csv (routes ≈ on-field pass plays: time_to_throw or route charted); man/zone route-snap counts same source.- nflverse pbp 2024–2025, loaded via nflreadpy 2026-07-07: in-game TS/AYS/WOPR, RZ/inside-10/end-zone targets, depth mix, throw-direction (MOF/boundary) mix, EPA/tgt, CPOE on targets, xFP/xTD (league expected-value by depth-bucket × end-zone flag, PPR), FTN join for catchable/drop/contested.
data/team-profiles/CHI.md(built 2026-07-07): play-caller tendencies, QB, OL, vacated-target math, depth chart, Vegas 9.5 win total, volume projections.data/adp/adp_ffc_2026-07-07.csv— FFC PPR mocks, 2026-07-07 (Odunze 55.0; Burden 46.2; Loveland 44.8; Swift 48.3; 27 WRs drafted ahead).data/raw/sleeper/players_2026-07-07.json— age/bio/depth chart/injury status, 2026-07-07.- Web (all fetched 2026-07-07): NBC Sports PFT + SI Bears — foot "new normal," no surgery (June 2026); FOX 32 Chicago + Windy City Gridiron — OTA/minicamp full participation, Williams targeting Odunze/Loveland/Burden most (June 2026); FantasyPros (Erickson) 2026 outlook — wks 1–8: 23.9% TS, 15.8 xFP/gm, 2.21 YPRR (2026); PlayerProfiler — 33.5% slot rate 2024; PFF via Yahoo/BearGogglesOn — ≥20 slot snaps in 8 of 12 games 2025; "sacrificial X" bear framing (Yahoo via BearGogglesOn, 2026); Chicago Sun-Times — Johnson on Burden (2026-05-29).
- UNVERIFIED: target-level man/zone YPRR-TPRR splits; provider xFP (replaced with computed pbp xFP above); press-win/release data.
- League scoring: assumed full PPR, 4pt pass TD, no TE premium — league-settings.md placeholders unconfirmed as of 2026-07-07.